 Read the peer reviews for this feature.
Download the graphs for this feature.
It is said that the ‘Railway King’ George Hudson once insisted: “I will have no statistics on my railway!” We have come a long way since anyone could express such sentiments and not be thought a fool - today it is data, as statistics are now termed, that can be called king.
In the 19th century, successive Railway Regulation Acts increased the levels of statistical information required from railway companies by the Board of Trade. To supply this, companies created statistical departments, although the North Eastern Railway was the only British railway company to approach the sophistication of US railroads in its collection and analysis of data.
The tough, competitive conditions of the inter-war years forced railway companies to adopt more rigorous methods, prior to nationalisation in 1948. Today, as Jonathan Raper of TransportAPI says: “Data is at the heart of public transport. Releasing it and ensuring that it is used to the best effect in regulation, and to create new value and new products and services, is what we want to do. More or less everyone agrees with that now.”
Our ability to collect this data, often as part of systems designed primarily for other purposes, has grown exponentially in a very short time. The cost of collection has correspondingly fallen, although the challenge of turning information into useful knowledge remains substantial - it took three years of iteration between Transport for London and MIT to develop an algorithm for a particular project.
Broadly speaking, three types of information are collected relating to the railway industry.
Firstly, there is a host of quantitative data about train running, timetables, infrastructure, track, and safety issues such as SPADs - inevitably most of this data is sourced and made available to the public by Network Rail under an Open Government Licence. NR data feeds became available in December 2012, allowing website and app developers to create information sources of great value to passengers.
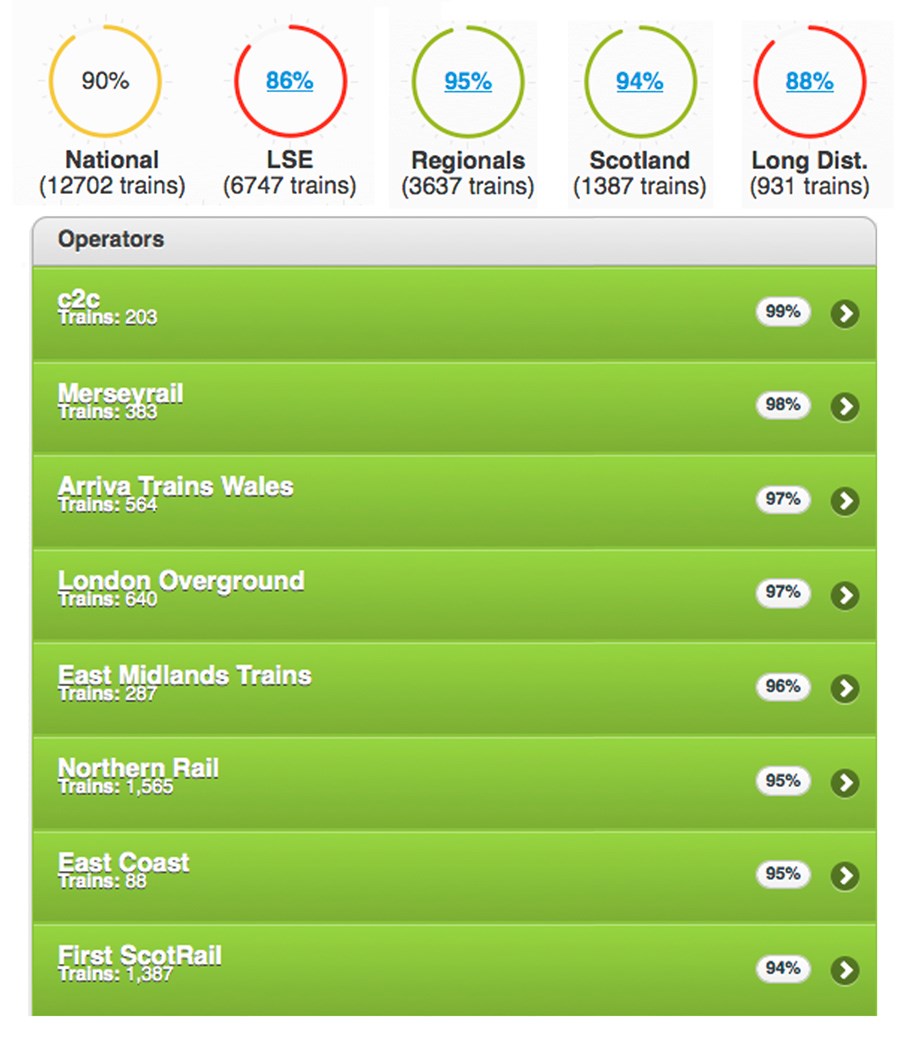
The NR website has a link to ‘data feeds’ and the sites that have been created using its data. For example, the third-party website Live PPM (Public Performance Measure) displays real-time performance information for each TOC, and receives more than ten million hits a month. Open Train Times has track diagrams showing the real-time position of each train in signal sections, and users can see the train arrival and departure times at stations. Trains.im has bar charts showing instantly which TOCs are having a good or bad day.
These developments are of value not only to rail customers, but also to the operators. As Peter Hicks, developer of Open Train Times, explains: “It’s popular with staff who use it in an advisory capacity. Platform staff use it to find out where trains are, I’ve had emails from signallers who want to see what’s happening at work when they’re off-shift, and I’ve been told that the British Transport Police has even used it when planning incident responses.” By releasing the data, NR has gained tools of value to both itself and the TOCs… at zero cost.
TOCs themselves generate data on timetables, fares and the routes over which fares are valid, and the Rail Settlement Plan (today’s Railway Clearing House) within ATOC is “authorised to make this data available under licence to third parties on behalf of the train companies, in order to promote rail travel and encourage the wider distribution of accurate and consistent rail travel information on an impartial basis”. Safeguards are put in place under the terms & conditions to which users must sign up, to protect the integrity of the data and to ensure that it is used accurately.
Following changes announced by the Rail Delivery Group in early 2014, a new online registration platform was launched in October giving developers automated access to the National Rail Enquiries (NRE) Darwin Webservice, making it even easier for people and organisations to use live train running information in their apps, websites and other services.
Darwin is the system paid for by train operators which analyses raw data from numerous rail industry sources to predict train arrival and departure times. This is part of the work of an RDG work stream headed by David Brown at Go-Ahead to extend openness and transparency in the rail industry.
ATOC Commercial Director David Mapp is leading on a joint research project with the Rail Safety & Standards Board to examine customer preferences such as the mode of transport to stations and catering preferences. The research is looking at the journey experience and ways in which TOCs and third party retailers such as thetrainline.com and redspottedhanky.com can use data to encourage additional trips through email and phone marketing.
The Rail Delivery Group has a dedicated transparency work stream, aimed at extending openness in the rail industry by making relevant data and information more accessible to rail users and other stakeholders.
On a broader level, the Office of Rail Regulation publishes statistical releases on eight themes: passenger and freight rail performance; passenger rail usage; freight rail usage; passenger rail service satisfaction; regional rail usage; key safety statistics; rail finance; and rail infrastructure, assets and environment. These are mostly self-explanatory, although the service satisfaction deals specifically with customer complaints.
The regional usage profiles aggregate data to show the number of passenger journeys within a region and to/from that region. They provide a fascinating insight into changes in travel patterns within Britain and are sufficiently detailed to show (for example) that although the increase in the number of journeys to outside the West Midlands area had slowed to its lowest level in a decade at 3.9%, travel to London and the North West from the West Midlands grew by 5.1% (2013-14 figures). Even more forensically, it can show remarkable localised spikes, such as a 17.8% increase in journeys starting or ending in Bridgend.
ORR also publishes data on station usage, collated by Steer Davies Gleave.
Much of this data is derived from LENNON (Latest Earnings Networked Nationally Over Night), the settlement system managed by the Rail Settlement Plan on behalf of train operators. The matrix covers roughly 2,500 stations. LENNON allocates revenue from the previous day’s transactions to the TOCs, but its data also allows MOIRA (a modelling tool to forecast the impact of service changes) to create a picture of daily average flows and allocates them to particular trains, thereby giving a picture of how full they are.
Looking beyond the rail sector at all modes of transport is the DfT’s National Travel Survey (NTS), a household survey begun in 1988 and designed “to monitor long-term trends in personal travel and to inform the development of policy”.
The survey collects information on how, why, when and where people travel, as well as factors affecting travel such as car availability and driving licence holding. The data is collected by face-to-face interviews with people in their homes and from a seven-day travel diary. It covers people in all age groups, including children.
It is from the NTS that the modal split can be evaluated - most recently it has shown the continuing strong growth in rail travel, greater modal share of public transport generally, plus a fall in the annual mileage of cars, which has encouraged debate over the notion of ‘peak car’. Although it has been suggested that the data is not analysed as extensively as it could be, the NTS is used to forecast patterns of travel and in transport modelling - for example, in looking at the siting of HS2 stations and their catchment areas.
 Supplementing the NTS are reports such as On the Move: Making sense of car and train travel trends in Britain, commissioned by the ORR, the Independent Transport Commission, Transport Scotland and the RAC Foundation.
Its object was “to identify the patterns of behaviour which underlie the observed national levelling off in car traffic in Great Britain - after decades of growth - and the continuing strong growth in rail passenger mileage, even during the current recession”. Its analysis was based largely on the NTS and therefore its remit excluded causality.
Regional organisations also add to the store of information about travel behaviour. For TfL’s London Travel Demand Survey (LTDS), 8,000 households are randomly selected to complete three questionnaires: household (giving demographic information such as vehicle ownership, income and housing tenure); individual (covering use of transport modes, driving licences, public transport tickets); and trip sheets for each household member aged five and over (detailing the mode, end points, duration and purpose of each trip). It is interviewer-led because it was found that without occasional prompts, people would forget making certain journeys.
Transport Scotland extracts the transport and travel-related questions from the Scottish Household Survey to produce Transport and Travel in Scotland. This looks at trends, echoing the NTS in recording a reduction in car traffic and significant increases in rail passengers and cycling (2013). The annual Scottish Transport Statistics are accompanied by some imaginative infographics.
Finally, there are the external sources of data that are of value to the railway.
At a Smarter Travel Forum organised by the Campaign for Better Transport, O2 showed work it had done examining smartphone data. The project aggregated what O2 calls the ‘exhaust emissions’ from the phones, to discern travel patterns between Edinburgh and London. They revealed that rail had a 25% market share and most of the rest was air, but the 25% was split - 17% travelled with East Coast, but 8% drove to Carlisle to pick up Virgin. Mapping of such clusters provides evidence for targeted marketing campaigns. ‘Big Data’ has the potential to play a significant role in planning changes to services and creating better networks.
The second type of data is qualitative, usually obtained either by email or face-to-face questionnaires, and which seeks to discover passenger perceptions of their journey experience. A network-wide approach is used by Passenger Focus, which consults more than 50,000 passengers a year to produce biannual reports from a representative sample of journeys on all franchise TOCs, with voluntary data contributions from four open access operators.
PF’s National Rail Passenger Survey (NRPS) gives a picture of trends on a variety of factors that influence a passenger’s experience, such as punctuality, cleanliness, seat availability, helpfulness of staff, station facilities and information. And it provides TOCs with pointers for action. For example, the autumn 2014 study highlighted yet again the high level of dissatisfaction with the way TOCs handle delays or cancellations. More usefully, it dug deeper and found that while the information before arrival at stations and once at stations is trusted, there is a low opinion of on-train information and automated announcements in particular.
However, while this gives TOCs a sense of whether aspects of their service are improving or deteriorating, it is of limited value when seeking an understanding of more local assessments. Consequently most TOCs carry out additional, more targeted research.
The Southern and Southeastern TOCs within the Go-Ahead Group, which also encompasses London Midland, Gatwick Express and GTR (Govia Thameslink Railway, taking in Thameslink and Great Northern), use the free online survey software SurveyMonkey to devise customer surveys to gain a deeper insight. Obviously this can only be done with those customers who have accessed those TOCs online, but surveys can be targeted to a specific station or area. These surveys often focus on the quality of information provided by the TOC and whether the right communication channels are being used.
To gain a wider picture of their customers and non-rail users, Southern and Southeastern use YouGov to hold online panels. These gather data on quality of service, perceptions of value for money, brand, fares, cleanliness and staff helpfulness, and examine the reasons why people do not use rail. Although comparable with PF’s NRPS, these surveys are more frequent and more detailed. They also provide socio-demographic information that helps a deeper analysis of their findings.
The third type of data, and the one that offers perhaps the greatest scope for innovation, surrounds ticketing and the information that sophisticated forms of ticketing provide about customer behaviour.
The Edmondson ticket and its thinner card successors provided the railway with no information except origin and destination. Season tickets, introduced as early as the 1830s on the Stockton & Darlington Railway, provided the first contact with passengers on a regular basis, although little more than address and gender would have been available. But it was the development of computer-based ticketing systems that laid the foundations for the data revolution.
British Rail invited 23 companies to tender for a computer-based ticket-issuing system. Thorn EMI won the contract, and installed the first APTIS (Accountancy and Passenger Ticket Issuing System) machine at Portsmouth & Southsea station in 1982. The £31 million investment envisaged the installation of 2,971 APTIS machines by September 1987, linked through the BR telephone network to a central computer in Nottingham.
The inability to adapt APTIS for chip-and-PIN credit card payments led to its demise by 2007 - it was gradually superseded by the PC-based Tribute system developed by BR Business Systems shortly before privatisation. The first terminal was installed at London St Pancras in 1994. Since privatisation, the software has been repeatedly updated by the French company Atos.
But it is the revolution in how passengers buy tickets that has created the potential for much greater interaction between a TOC and the customer.
When that first Tribute machine was installed in the mid-1990s, about 80% of ticket sales were transacted at a booking office window. Today, just under half of all tickets are sold through a booking office or a station ticket vending machine. Chiltern Railways was in the vanguard of mobile IT - it was the first TOC to offer tickets by text message, and the first to offer a mobile app that both sold and fulfilled tickets to barcode, in 2007. These unlock valuable data.
Advance purchase tickets bought online provide TOCs with much more information than season ticket purchases. Each visit to the website provides an insight into what the customer is looking at, and builds a profile for targeted emails.
However, Katy Taylor, group marketing director of Go-Ahead Group, cautions against simplified segmentation: “We found that customers don’t like being told. They like choice and not being pushed outside their comfort zone. Because someone has a family, it doesn’t mean spa breaks with the girls are a thing of the past. Older customers may well be looking for things to entertain their grandchildren.”
Southern and Southeastern employ an eCRM system (electronic customer relation management) based on customers registered online.
Says Taylor: “We are looking at our customers and matching them with external profiling data such as Acorn or Experian’s Mosaic .
“They create profiles based on factors such as kids, age, wealth, newspapers read, and so on, and we match our data against groupings. We are looking to understand why, for example, one season ticket holder travels with their family at weekends against someone who doesn’t. We can then target them with offers that match lifestyle with a leisure destination to encourage off-peak journeys. We may do theatre mailings, perhaps in conjunction with an offer, and we do some paid advertising to target non-customers.
“We hope to use Twitter for real-time service information, and app usage allows us to build a picture so that if we know someone takes a train regularly within a one-hour window in the morning, and one of those trains is cancelled, we can send a message. If we know a passenger arrives at Brighton station each morning, we could send an offer in partnership with a retailer in the town.
“We use Facebook for greater engagement with communities, and it allows us to post videos. It’s also important to know which phones to develop apps for - in the South East it is predominantly iPhones, whereas in the London Midland area Android is more common. And we are seeing more Windows on Nokia phones, although it is still small.
“We rely on ATOC for information about railcards and network offers. Interestingly the 2FOR1 London offers have been taken up more by groups of adults rather than families, and apparently London Midland has had the highest take-up.”
The next revolution in data will come through the wider use of smartcards, producing comparable levels of data to the earlier Oyster card (see TfL case study, page 51).
The technology relies on ITSO (Integrated Transport Smartcard Organisation) Ltd, a non-profit standardisation and interoperability membership organisation that maintains and develops the ITSO specification for transport smartcards. It was established as a result of discussions between various UK passenger transport authorities concerning the lack of standards for interoperable smartcard ticketing. Its role is to facilitate and support the development of interoperable smart ticketing schemes complying with the ITSO specification.
Southern has introduced the key smartcard at 16 stations, with the rest of its network to follow. Weekly, monthly and annual season tickets can be loaded onto it, and which include a London travelcard allowing use of trains, buses, trams and the Underground. Tickets can also be bought online up to two hours before travel and loaded onto the key card at a station reader. Alternatively tickets can be bought at a Southern TVM.
A key card also confers savings on membership of City Car Club in Brighton, and on electric vehicle rental in nine towns served by Co-Wheels. Also open to key smartcard customers is keyGo, which allows customers to pay for their journey via a top-up system, similar to a pay-as-you-go.
Another target for Go-Ahead is to be able to give automatic credits for delayed trains - the building blocks are being put in place to recognise the sale of a ticket allowing the use of a particular train, and that the person passed through certain points and was therefore almost certainly on that train. Conversely, smartcards can also highlight suspicious transactions to help detection of fraud.
Go-Ahead’s Taylor also envisages the development of more sophisticated traffic light and information systems for train loading. London Midland already offers information about which commuter trains calling at certain of its busiest stations have spare seats. Passengers can find out if any of these trains have fewer seats than normal by following London Midland on Twitter. More stations are being added.
In common with most rolling stock introduced over the past decade, the Class 700 Siemens Desiro City trains being built for Thameslink will offer passenger loading information, provided by a counting system mounted above the doorways coupled with load sensors attached to the floor. This data can enable the operator to warn passengers not only which trains are full, but also to advise which carriages have space and therefore where to stand on the platform. The challenge comes with working out algorithms that can predict how many people will get off the train at that station - busy intermediate stations such as Clapham Junction can turn a packed train into a half-full train.
Such sophistication comes at a price, however. “It costs a lot to go through data, and you need to understand what value you are going to get out of it,” says Taylor. “Even managing app messaging requires in-house resources on some scale. What do we want to get out of it? Are the benefits perceived by the customer enough to justify the costs through an increase in business?”
Some argue that the rail industry has been slower than others (aviation, for example) to embrace innovations such as the smartcard. The retail market review now being conducted by ORR is considering “how current regulation and industry arrangements and practices within the retail market are facilitating choice and, in particular, promoting investment and innovation in the best interest of passengers”.
Siobhan Carty, competition and markets policy manager at ORR, says: “The TOCs do a good job of working together in the interests of an integrated national ticket system based on common platforms. But the TOCs have different agendas - commuter, long-distance, regional - and their franchises terminate at different times. There is a feeling that the industry lacks incentive to innovate, and moves at the pace of the slowest common denominator.
“The DfT is looking at making more funding available for innovation in retailing, following the mandatory smart ticketing in the South East. The challenge is how to contractualise a requirement for the TOCs to develop systems collaboratively. What does more innovation look like, when TOCs have different strategies - a long-distance TOC is bound to be less interested in smartcards? We shall have a clearer idea of recommendations for change by early summer.”
Additional revenue is the fundamental object of all this data crunching, but there is one use of data with which TOCs are less than happy - dissecting fares.
This may have been behind an earlier reluctance to release data on the rather hollow pretext of commercial confidentiality, given how little real competition there is (or should be, given that there is plenty of competition from other modes). Only on a very few corridors such as London-Birmingham and the East Coast Main Line is there any meaningful day-to-day competition between TOCs.
The ability of passengers to save money by split ticketing is at the heart of the TOCs’ anxiety. Raileasy’s website has a section for finding such fares, while Innovate UK has provided funding for TransportAPI, Raileasy, City University and DigitalMR for a project called FareViz to create a database of all the fares in the country.
TransportAPI’s Raper points to the substantial saving of split ticketing when a journey starts during peak hours but most of it is not, or where long-distance pricing meets metropolitan pricing. He argues that there is a danger the likes of Microsoft, Google or Apple might become disruptive operators and start selling journeys, buying in bulk and commodifying the operators who will dance to their tune.
“The railway industry should be creating an ecosystem of organisations working within the current model, to allow the innovation to take place that prevents the disaggregation if bigger guys come in. If there isn’t a problem, there will be nothing to come in and solve.”
Stephen Joseph, Chief Executive of Campaign for Better Transport, agrees that the industry needs to stop being frightened and let the information out.
But he foresees a battle over ownership of the ever more valuable data - for example, in the refranchised Northern and TransPennine services, which will be designed and managed by the DfT-Rail North partnership. Will northern local authorities have access to the data for bespoke marketing?
As he puts it: “Anyone who claims to know how all this is going to play out is a fool or is selling something.”
It is said that the ‘Railway King’ George Hudson once insisted: “I will have no statistics on my railway!” We have come a long way since anyone could express such sentiments and not be thought a fool - today it is data, as statistics are now termed, that can be called king.
In the 19th century, successive Railway Regulation Acts increased the levels of statistical information required from railway companies by the Board of Trade. To supply this, companies created statistical departments, although the North Eastern Railway was the only British railway company to approach the sophistication of US railroads in its collection and analysis of data.
The tough, competitive conditions of the inter-war years forced railway companies to adopt more rigorous methods, prior to nationalisation in 1948. Today, as Jonathan Raper of TransportAPI says: “Data is at the heart of public transport. Releasing it and ensuring that it is used to the best effect in regulation, and to create new value and new products and services, is what we want to do. More or less everyone agrees with that now.”
Our ability to collect this data, often as part of systems designed primarily for other purposes, has grown exponentially in a very short time. The cost of collection has correspondingly fallen, although the challenge of turning information into useful knowledge remains substantial - it took three years of iteration between Transport for London and MIT to develop an algorithm for a particular project.
Broadly speaking, three types of information are collected relating to the railway industry.
Firstly, there is a host of quantitative data about train running, timetables, infrastructure, track, and safety issues such as SPADs - inevitably most of this data is sourced and made available to the public by Network Rail under an Open Government Licence. NR data feeds became available in December 2012, allowing website and app developers to create information sources of great value to passengers.
The NR website has a link to ‘data feeds’ and the sites that have been created using its data. For example, the third-party website Live PPM (Public Performance Measure) displays real-time performance information for each TOC, and receives more than ten million hits a month. Open Train Times has track diagrams showing the real-time position of each train in signal sections, and users can see the train arrival and departure times at stations. Trains.im has bar charts showing instantly which TOCs are having a good or bad day.
These developments are of value not only to rail customers, but also to the operators. As Peter Hicks, developer of Open Train Times, explains: “It’s popular with staff who use it in an advisory capacity. Platform staff use it to find out where trains are, I’ve had emails from signallers who want to see what’s happening at work when they’re off-shift, and I’ve been told that the British Transport Police has even used it when planning incident responses.” By releasing the data, NR has gained tools of value to both itself and the TOCs… at zero cost.
TOCs themselves generate data on timetables, fares and the routes over which fares are valid, and the Rail Settlement Plan (today’s Railway Clearing House) within ATOC is “authorised to make this data available under licence to third parties on behalf of the train companies, in order to promote rail travel and encourage the wider distribution of accurate and consistent rail travel information on an impartial basis”. Safeguards are put in place under the terms & conditions to which users must sign up, to protect the integrity of the data and to ensure that it is used accurately.
Following changes announced by the Rail Delivery Group in early 2014, a new online registration platform was launched in October giving developers automated access to the National Rail Enquiries (NRE) Darwin Webservice, making it even easier for people and organisations to use live train running information in their apps, websites and other services.
Darwin is the system paid for by train operators which analyses raw data from numerous rail industry sources to predict train arrival and departure times. This is part of the work of an RDG work stream headed by David Brown at Go-Ahead to extend openness and transparency in the rail industry.
ATOC Commercial Director David Mapp is leading on a joint research project with the Rail Safety & Standards Board to examine customer preferences such as the mode of transport to stations and catering preferences. The research is looking at the journey experience and ways in which TOCs and third party retailers such as thetrainline.com and redspottedhanky.com can use data to encourage additional trips through email and phone marketing.
The Rail Delivery Group has a dedicated transparency work stream, aimed at extending openness in the rail industry by making relevant data and information more accessible to rail users and other stakeholders.
On a broader level, the Office of Rail Regulation publishes statistical releases on eight themes: passenger and freight rail performance; passenger rail usage; freight rail usage; passenger rail service satisfaction; regional rail usage; key safety statistics; rail finance; and rail infrastructure, assets and environment. These are mostly self-explanatory, although the service satisfaction deals specifically with customer complaints.
The regional usage profiles aggregate data to show the number of passenger journeys within a region and to/from that region. They provide a fascinating insight into changes in travel patterns within Britain and are sufficiently detailed to show (for example) that although the increase in the number of journeys to outside the West Midlands area had slowed to its lowest level in a decade at 3.9%, travel to London and the North West from the West Midlands grew by 5.1% (2013-14 figures). Even more forensically, it can show remarkable localised spikes, such as a 17.8% increase in journeys starting or ending in Bridgend.
ORR also publishes data on station usage, collated by Steer Davies Gleave.
Much of this data is derived from LENNON (Latest Earnings Networked Nationally Over Night), the settlement system managed by the Rail Settlement Plan on behalf of train operators. The matrix covers roughly 2,500 stations. LENNON allocates revenue from the previous day’s transactions to the TOCs, but its data also allows MOIRA (a modelling tool to forecast the impact of service changes) to create a picture of daily average flows and allocates them to particular trains, thereby giving a picture of how full they are.
Looking beyond the rail sector at all modes of transport is the DfT’s National Travel Survey (NTS), a household survey begun in 1988 and designed “to monitor long-term trends in personal travel and to inform the development of policy”.
The survey collects information on how, why, when and where people travel, as well as factors affecting travel such as car availability and driving licence holding. The data is collected by face-to-face interviews with people in their homes and from a seven-day travel diary. It covers people in all age groups, including children.
It is from the NTS that the modal split can be evaluated - most recently it has shown the continuing strong growth in rail travel, greater modal share of public transport generally, plus a fall in the annual mileage of cars, which has encouraged debate over the notion of ‘peak car’. Although it has been suggested that the data is not analysed as extensively as it could be, the NTS is used to forecast patterns of travel and in transport modelling - for example, in looking at the siting of HS2 stations and their catchment areas.
Supplementing the NTS are reports such as On the Move: Making sense of car and train travel trends in Britain, commissioned by the ORR, the Independent Transport Commission, Transport Scotland and the RAC Foundation.
Its object was “to identify the patterns of behaviour which underlie the observed national levelling off in car traffic in Great Britain - after decades of growth - and the continuing strong growth in rail passenger mileage, even during the current recession”. Its analysis was based largely on the NTS and therefore its remit excluded causality.
Regional organisations also add to the store of information about travel behaviour. For TfL’s London Travel Demand Survey (LTDS), 8,000 households are randomly selected to complete three questionnaires: household (giving demographic information such as vehicle ownership, income and housing tenure); individual (covering use of transport modes, driving licences, public transport tickets); and trip sheets for each household member aged five and over (detailing the mode, end points, duration and purpose of each trip). It is interviewer-led because it was found that without occasional prompts, people would forget making certain journeys.
Transport Scotland extracts the transport and travel-related questions from the Scottish Household Survey to produce Transport and Travel in Scotland. This looks at trends, echoing the NTS in recording a reduction in car traffic and significant increases in rail passengers and cycling (2013). The annual Scottish Transport Statistics are accompanied by some imaginative infographics.
Finally, there are the external sources of data that are of value to the railway.
At a Smarter Travel Forum organised by the Campaign for Better Transport, O2 showed work it had done examining smartphone data. The project aggregated what O2 calls the ‘exhaust emissions’ from the phones, to discern travel patterns between Edinburgh and London. They revealed that rail had a 25% market share and most of the rest was air, but the 25% was split - 17% travelled with East Coast, but 8% drove to Carlisle to pick up Virgin. Mapping of such clusters provides evidence for targeted marketing campaigns. ‘Big Data’ has the potential to play a significant role in planning changes to services and creating better networks.
The second type of data is qualitative, usually obtained either by email or face-to-face questionnaires, and which seeks to discover passenger perceptions of their journey experience. A network-wide approach is used by Passenger Focus, which consults more than 50,000 passengers a year to produce biannual reports from a representative sample of journeys on all franchise TOCs, with voluntary data contributions from four open access operators.
PF’s National Rail Passenger Survey (NRPS) gives a picture of trends on a variety of factors that influence a passenger’s experience, such as punctuality, cleanliness, seat availability, helpfulness of staff, station facilities and information. And it provides TOCs with pointers for action. For example, the autumn 2014 study highlighted yet again the high level of dissatisfaction with the way TOCs handle delays or cancellations. More usefully, it dug deeper and found that while the information before arrival at stations and once at stations is trusted, there is a low opinion of on-train information and automated announcements in particular.
However, while this gives TOCs a sense of whether aspects of their service are improving or deteriorating, it is of limited value when seeking an understanding of more local assessments. Consequently most TOCs carry out additional, more targeted research.
The Southern and Southeastern TOCs within the Go-Ahead Group, which also encompasses London Midland, Gatwick Express and GTR (Govia Thameslink Railway, taking in Thameslink and Great Northern), use the free online survey software SurveyMonkey to devise customer surveys to gain a deeper insight. Obviously this can only be done with those customers who have accessed those TOCs online, but surveys can be targeted to a specific station or area. These surveys often focus on the quality of information provided by the TOC and whether the right communication channels are being used.
To gain a wider picture of their customers and non-rail users, Southern and Southeastern use YouGov to hold online panels. These gather data on quality of service, perceptions of value for money, brand, fares, cleanliness and staff helpfulness, and examine the reasons why people do not use rail. Although comparable with PF’s NRPS, these surveys are more frequent and more detailed. They also provide socio-demographic information that helps a deeper analysis of their findings.
The third type of data, and the one that offers perhaps the greatest scope for innovation, surrounds ticketing and the information that sophisticated forms of ticketing provide about customer behaviour.
The Edmondson ticket and its thinner card successors provided the railway with no information except origin and destination. Season tickets, introduced as early as the 1830s on the Stockton & Darlington Railway, provided the first contact with passengers on a regular basis, although little more than address and gender would have been available. But it was the development of computer-based ticketing systems that laid the foundations for the data revolution.
British Rail invited 23 companies to tender for a computer-based ticket-issuing system. Thorn EMI won the contract, and installed the first APTIS (Accountancy and Passenger Ticket Issuing System) machine at Portsmouth & Southsea station in 1982. The £31 million investment envisaged the installation of 2,971 APTIS machines by September 1987, linked through the BR telephone network to a central computer in Nottingham.
The inability to adapt APTIS for chip-and-PIN credit card payments led to its demise by 2007 - it was gradually superseded by the PC-based Tribute system developed by BR Business Systems shortly before privatisation. The first terminal was installed at London St Pancras in 1994. Since privatisation, the software has been repeatedly updated by the French company Atos.
But it is the revolution in how passengers buy tickets that has created the potential for much greater interaction between a TOC and the customer.
When that first Tribute machine was installed in the mid-1990s, about 80% of ticket sales were transacted at a booking office window. Today, just under half of all tickets are sold through a booking office or a station ticket vending machine. Chiltern Railways was in the vanguard of mobile IT - it was the first TOC to offer tickets by text message, and the first to offer a mobile app that both sold and fulfilled tickets to barcode, in 2007. These unlock valuable data.
Advance purchase tickets bought online provide TOCs with much more information than season ticket purchases. Each visit to the website provides an insight into what the customer is looking at, and builds a profile for targeted emails.
However, Katy Taylor, group marketing director of Go-Ahead Group, cautions against simplified segmentation: “We found that customers don’t like being told. They like choice and not being pushed outside their comfort zone. Because someone has a family, it doesn’t mean spa breaks with the girls are a thing of the past. Older customers may well be looking for things to entertain their grandchildren.”
Southern and Southeastern employ an eCRM system (electronic customer relation management) based on customers registered online.
Says Taylor: “We are looking at our customers and matching them with external profiling data such as Acorn or Experian’s Mosaic .
“They create profiles based on factors such as kids, age, wealth, newspapers read, and so on, and we match our data against groupings. We are looking to understand why, for example, one season ticket holder travels with their family at weekends against someone who doesn’t. We can then target them with offers that match lifestyle with a leisure destination to encourage off-peak journeys. We may do theatre mailings, perhaps in conjunction with an offer, and we do some paid advertising to target non-customers.
“We hope to use Twitter for real-time service information, and app usage allows us to build a picture so that if we know someone takes a train regularly within a one-hour window in the morning, and one of those trains is cancelled, we can send a message. If we know a passenger arrives at Brighton station each morning, we could send an offer in partnership with a retailer in the town.
“We use Facebook for greater engagement with communities, and it allows us to post videos. It’s also important to know which phones to develop apps for - in the South East it is predominantly iPhones, whereas in the London Midland area Android is more common. And we are seeing more Windows on Nokia phones, although it is still small.
“We rely on ATOC for information about railcards and network offers. Interestingly the 2FOR1 London offers have been taken up more by groups of adults rather than families, and apparently London Midland has had the highest take-up.”
The next revolution in data will come through the wider use of smartcards, producing comparable levels of data to the earlier Oyster card (see TfL case study, page 51).
The technology relies on ITSO (Integrated Transport Smartcard Organisation) Ltd, a non-profit standardisation and interoperability membership organisation that maintains and develops the ITSO specification for transport smartcards. It was established as a result of discussions between various UK passenger transport authorities concerning the lack of standards for interoperable smartcard ticketing. Its role is to facilitate and support the development of interoperable smart ticketing schemes complying with the ITSO specification.
Southern has introduced the key smartcard at 16 stations, with the rest of its network to follow. Weekly, monthly and annual season tickets can be loaded onto it, and which include a London travelcard allowing use of trains, buses, trams and the Underground. Tickets can also be bought online up to two hours before travel and loaded onto the key card at a station reader. Alternatively tickets can be bought at a Southern TVM.
A key card also confers savings on membership of City Car Club in Brighton, and on electric vehicle rental in nine towns served by Co-Wheels. Also open to key smartcard customers is keyGo, which allows customers to pay for their journey via a top-up system, similar to a pay-as-you-go.
Another target for Go-Ahead is to be able to give automatic credits for delayed trains - the building blocks are being put in place to recognise the sale of a ticket allowing the use of a particular train, and that the person passed through certain points and was therefore almost certainly on that train. Conversely, smartcards can also highlight suspicious transactions to help detection of fraud.
Go-Ahead’s Taylor also envisages the development of more sophisticated traffic light and information systems for train loading. London Midland already offers information about which commuter trains calling at certain of its busiest stations have spare seats. Passengers can find out if any of these trains have fewer seats than normal by following London Midland on Twitter. More stations are being added.
In common with most rolling stock introduced over the past decade, the Class 700 Siemens Desiro City trains being built for Thameslink will offer passenger loading information, provided by a counting system mounted above the doorways coupled with load sensors attached to the floor. This data can enable the operator to warn passengers not only which trains are full, but also to advise which carriages have space and therefore where to stand on the platform. The challenge comes with working out algorithms that can predict how many people will get off the train at that station - busy intermediate stations such as Clapham Junction can turn a packed train into a half-full train.
Such sophistication comes at a price, however. “It costs a lot to go through data, and you need to understand what value you are going to get out of it,” says Taylor. “Even managing app messaging requires in-house resources on some scale. What do we want to get out of it? Are the benefits perceived by the customer enough to justify the costs through an increase in business?”
Some argue that the rail industry has been slower than others (aviation, for example) to embrace innovations such as the smartcard. The retail market review now being conducted by ORR is considering “how current regulation and industry arrangements and practices within the retail market are facilitating choice and, in particular, promoting investment and innovation in the best interest of passengers”.
Siobhan Carty, competition and markets policy manager at ORR, says: “The TOCs do a good job of working together in the interests of an integrated national ticket system based on common platforms. But the TOCs have different agendas - commuter, long-distance, regional - and their franchises terminate at different times. There is a feeling that the industry lacks incentive to innovate, and moves at the pace of the slowest common denominator.
“The DfT is looking at making more funding available for innovation in retailing, following the mandatory smart ticketing in the South East. The challenge is how to contractualise a requirement for the TOCs to develop systems collaboratively. What does more innovation look like, when TOCs have different strategies - a long-distance TOC is bound to be less interested in smartcards? We shall have a clearer idea of recommendations for change by early summer.”
Additional revenue is the fundamental object of all this data crunching, but there is one use of data with which TOCs are less than happy - dissecting fares.
This may have been behind an earlier reluctance to release data on the rather hollow pretext of commercial confidentiality, given how little real competition there is (or should be, given that there is plenty of competition from other modes). Only on a very few corridors such as London-Birmingham and the East Coast Main Line is there any meaningful day-to-day competition between TOCs.
The ability of passengers to save money by split ticketing is at the heart of the TOCs’ anxiety. Raileasy’s website has a section for finding such fares, while Innovate UK has provided funding for TransportAPI, Raileasy, City University and DigitalMR for a project called FareViz to create a database of all the fares in the country.
TransportAPI’s Raper points to the substantial saving of split ticketing when a journey starts during peak hours but most of it is not, or where long-distance pricing meets metropolitan pricing. He argues that there is a danger the likes of Microsoft, Google or Apple might become disruptive operators and start selling journeys, buying in bulk and commodifying the operators who will dance to their tune.
“The railway industry should be creating an ecosystem of organisations working within the current model, to allow the innovation to take place that prevents the disaggregation if bigger guys come in. If there isn’t a problem, there will be nothing to come in and solve.”
Stephen Joseph, Chief Executive of Campaign for Better Transport, agrees that the industry needs to stop being frightened and let the information out.
But he foresees a battle over ownership of the ever more valuable data - for example, in the refranchised Northern and TransPennine services, which will be designed and managed by the DfT-Rail North partnership. Will northern local authorities have access to the data for bespoke marketing?
As he puts it: “Anyone who claims to know how all this is going to play out is a fool or is selling something.”
 Peer review: Trevor Birch
Partner, PA Consulting Group
Anthony provides a wide overview of data collected across the rail industry, and a guide to how some of it is used. My instinctive reaction is how much it reflects the fragmentation of the rail industry - data being collected in so many ways by so many organisations with no single organisation able to provide a comprehensive overview of the system. That said, there is hope for the future with some great initiatives under way across the industry.
In global terms, our railway needs to:
Be more efficient – much of the infrastructure is old and we demand high performance from it. We need to maintain, upgrade and replace it efficiently while minimising disruption. Data can help and Network Rail is making massive investments to do this through its ORBIS programme - looking at increasing the data available from assets on the railway through new technology and better communication, including the remote monitoring of equipment and a move to more predictive maintenance.
NR is also seeking to make better use of data we already have, improving the codification and structure of data, linking information sources, enhancing the analysis of that data, and providing more technology to staff so that they can access that data and exploit the insight it provides. This will help NR and operators better understand performance.
Be more integrated - not simply between operators and the infrastructure owner, but also with the wider transport system. The article touched on analysis of phone data to better understand travel between Edinburgh and London - this is a great example, and much more can and is being done.
The retail industry knows (from phone data) where people travel from to get to a shopping centre and how they behave once they get there, including which shops they visit and how they move around those shops. (They can also communicate with their customers, real time, making offers or giving information.) Planners need similar understanding of the transport system and the behaviours of our passengers as they move around it – across modes - before they arrive on the rail network. This is essential for effective urban planning, reducing congestion, and promoting more effective use of rail.
Phones are a great example of how more can be done linking data sources, using big data techniques and data visualisation to provide a much more integrated understanding of how we travel and how we can make most effective use of the system.
Make better use of its capacity – McNulty highlighted that much of the rail network runs at capacity for only limited periods each day, with ‘empty’ trains running around the system for much of the rest of the time. We have to better exploit this capacity to make the railway more cost-effective and to support the economy. Data can help us understand how to do this - encourage existing passengers to change their travel patterns and attract new customers who would use the railway at quieter times.
Focusing more on these points, I agree that some of the greatest opportunities surround ticketing. The case study described some of the benefits Transport for London is reaping from its investment in Oyster - TfL knows much more about its customers, their travel behaviour and how its tickets are being used once sold. It can also communicate with customers to influence travel patterns and better manage disruption. Magnetic stripe tickets don’t provide this data - they open the gates without any audit trail of who, where, when or how often they are used.
Translate this to the national rail system and you understand why the DfT is investing in South East Flexible Ticketing, and why TOCs such as Southern and c2c are already moving to smart. Create a multi-modal system supporting ticketing on buses (as Oyster does), and you understand why DfT is supporting ticket schemes in cities and promoting a ticketing scheme for the north of England.
What has this to do with data? Data from smart ticketing can help the industry:
- Better understand travel patterns and demand, with much greater accuracy generated from actual use and less reliance on market surveys.
- Create new products that both exploit capacity and meet demand. Season tickets are great if you travel five days per week, but not if you work part-time, have irregular shift patterns or straddle peaks.
- Support multi-modal integration - supporting tickets that can be used on buses, trains and supporting parking.
- Build stronger relationships with its customers. It’s ironic, given the revenue of the rail industry, that it knows little about who its customers are.
Creating this data from ticketing is not without its challenges:
- Who owns the data? In simple terms, it’s a franchise asset that stays within the industry. In real terms it can become complicated. TOCs are often managed by large transport groups that have interests in bus operations, want to sell multi-modal tickets, and want to build relationships with their customers. Passengers don’t just travel on rail, and may want to choose who they have a relationship with.
- Fears of “Big Brother” - most people with a phone understand that they can be tracked, but not everyone likes it and not everyone will be happy to be tracked by their train ticket. The industry has to provide customer comfort.
- Building the right relationship - junk mail has been replaced by spam and nuisance calls as irritants in modern life. Not everyone wants to be sold to, and as technology advances we will build a much greater understanding of our customers and how they travel. We will need to use that data wisely, and think carefully how we communicate with them.
- Quantitative data is not the full picture - we will still need qualitative surveys to build a richer picture, and fully understand latent demand and perceptions of quality.
Overall, it’s an exciting future but not a simple one. We must always be aware of the cyber risk - the more we connect our railway, the more data we are able to collect and the more we expose the system to cyber threats. We have to build resilience into our network to protect ourselves.
- Trevor is part of PA’s global leadership team for Transport and leads in UK Rail. He is currently working with the Department for Transport providing advice on the delivery of its smart ticketing programme.
 Peer review: Bhoopathi Rapolu
Head of Analytics EMEA, Cyient
This article went into a lot of detail about data collection and topics such as innovation, accountability, ownership and future trends. However, I would like to touch on a couple of points that I feel could have been explored in further detail.
Firstly, while the coverage of data sources was very detailed, all of the examples used referred to the consumer side of the industry. I would like to have seen more consideration being given to how data is being used in the operational side of the railway.
Operations and Maintenance (O&M) in the rail industry has undergone revolutionary changes in the past few years, in terms of data collection and application of that data for Condition Based Monitoring (CBM) and Predictive Maintenance (PM). CBM is a strategy that assesses the condition of each component to decipher what maintenance needs to be done and when best to carry it out. PM takes this one step further, by identifying looming faults and forecasting the optimal time for maintenance, enabling action to be taken before a fault occurs.
Recently, there has been a significant increase in data collection from signalling systems, network and wayside assets. Huge advancements in sensors and communication technologies have been made in the past few years that have led to continuous data collection from various systems and subsystems in trains. These enable mechanical and electrical conditions, operational efficiency and multiple other performance indicators to be monitored 24/7, allowing maintenance activities to be planned with the maximum interval between repairs, while minimising the number and cost of unscheduled outages created by system failures.
Secondly, the section on data source classification could have been a little clearer. Of course, there are different ways to classify different types of data in the rail industry, but a dataset is either quantitative or qualitative. Anthony refers to passenger ticketing data as a third distinctive group, whereas it should really be taken as quantitative data. Yes, there is a significant amount of passenger data to be considered, but when you compare this with the sheer volume of machine data being generated from trains in real-time, the size is irrelevant - it should all still be classified as quantitative.
Finally, while the various methods of data collection were covered in depth, it would have been beneficial to hear a greater analysis focused on the application of this data and the resulting benefits to both the industry and passengers.
There could have been more discussion around how that data was being used and what benefits had been realised so far. The benefits of using data in PM are significant, as it can help increase the availability and reliability of train services and reduce maintenance costs. This is especially important at a time when there is such a spotlight on network operators to improve the quality of service for passengers. PM enhances the overall effectiveness of transportation systems, ultimately leading to improved safety and higher customer satisfaction.
Overall, the piece was very informative and engaging, but could have built further on aspects such as how machine and sensor data is being collected and used in the operational side of the industry for CBM and PM, and some of the benefits of this - both to the rail industry as a whole and to passengers on the trains.
 Peer review: Anthony Smith
Chief Executive, Passenger Focus
Making more data and information available to passengers will enable them to make more informed choices. Greater transparency is most important for train performance, because getting to their destination on time is what passengers ‘buy’ when they purchase their ticket. Train companies must do more to make themselves accountable to passengers for providing this service, so making more useful data available is key.
Passenger Focus’ objective is for the rail industry to become more transparent - we push industry bodies to release their own data, and to publish information to meet demand. We opened up our own data, creating a ‘data explorer’ for our complaints and National Rail Passenger Survey results that allows passengers to explore satisfaction with train companies over time.
We recommend far greater transparency of information relevant to passenger experience. This is not only right in principle, given that passengers and taxpayers fund the railway, it is also key to building trust between a train company and its customers.
Although there is already some performance information in the public domain, there is more to be done. We believe it is entirely reasonable for passengers to expect to be able to find out about the performance of their specific train service on the train company website - which isn’t always the case. This needs to change.
Until passengers can easily see data for the particular trains they use, for example a commuter who only ever uses the 0723 and the 1719 in and out of London, the accusation will remain that the rail industry is hiding the truth within an average that is not representative of an individual’s experience.
This kind of disaggregated performance information is already available to passengers via third party websites. However, what is needed to develop real trust among passengers and stakeholders is a genuine ‘nothing to hide’ culture. This is about being (and being seen to be) open and honest about the track record in service delivery. It is about not expecting valued customers to have to submit a Freedom of Information request or to search for a website that uses Network Rail’s open data feeds.
Train companies need to provide access to historic data that can be searched in a variety of different ways. Ultimately, a passenger should be able to see the performance of their trains to whatever parameter they wish, including ‘right-time’ and between any pair of stations, not just the final destination of the train.
Giving rail passengers access to performance figures relevant to their services will no doubt give some passengers tools that help them hold their train company to account more effectively than they can at present. We regard that as a good thing, that good managers should not feel threatened by. Indeed, transparency may help drive improvement - for example, poor punctuality at intermediate stations may prompt work on a solution to a problem previously only visible to passengers. Passengers would also welcome greater transparency about crowding. Research by the Office of Rail Regulation found that passengers not only wanted more information, but acted upon it when planning their journeys.
We recommend the adoption of an open and honest culture, making data and information available to passengers, to help to build trust between train companies and their passengers.
, stands at Peterborough on April 8 2023. The ‘90’ has been acquired by Freightliner from DB Cargo. PIP DUNN.")

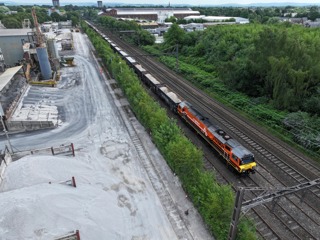


, stands at Peterborough on April 8 2023. The ‘90’ has been acquired by Freightliner from DB Cargo. PIP DUNN.")


Login to comment
Comments
No comments have been made yet.